


California’s 30 x 30 Initiative at its Midpoint
A Biodiversity Assessment Snapshot of the State’s Conservation Areas
Jeanette Howard, Carrie Schloss, Rachael Olliff Yang, Alicia Canales, Charlotte K. Stanley, Megan Webb, David Ackerly, Carl Boettiger, Cassie Buhler, Steven Monfort, Gary Bucciarelli, Rachel Meyer, Ariel Levi Simons, Jun Bando, Liz Chamberlin, Sam Veloz, Cole Dickison, Avery Hill, Rebecca Johnson, Ryan Hill, Amanda Kochanek, Dan Rademacher, Lisa Micheli, Kristeen Penrod, Giovanni Rapacciuolo, Nathaniel Roth, Dena Spatz, Daniel Gluesenkamp, and collaborators
Our planet is in the midst of a severe biodiversity decline, and California is no exception. Across North America, large numbers of birds, insects, amphibians, and mammals have declined, and many species’ historic ranges have contracted (Rosenberg et al. 2019, Crossley et al. 2020, Liebert and Ripple 2004). California is the most biologically diverse state in the country (CDFW SWAP 2025, Hamilton et al. 2022) and is home to the greatest number of unprotected, range-restricted imperiled species in the continental United States (Hamilton et al. 2022). The state is also one of 36 global biodiversity hotspots—regions with exceptional biodiversity that are simultaneously threatened by development and land-use conversion (Myers 2000).
Land protection has long been a central strategy for addressing biodiversity decline and will remain critical in responding to the current crisis. In December 2022, over 190 countries adopted the Kunming–Montreal Global Biodiversity Framework (the “Biodiversity Plan”), an international agreement with 23 targets aimed at halting and reversing biodiversity loss. Target 3, widely known as “30×30,” calls for 30% of the world’s terrestrial, inland water, and coastal and marine areas to be “effectively conserved and managed through ecologically representative, well-connected, and equitably governed systems” by 2030.
California moved early on this global commitment. In October 2020, Governor Gavin Newsom issued Executive Order N-82-20, launching the state’s 30×30 initiative and setting a target to conserve 30% of California’s lands and coastal waters by 2030. The initiative is organized around three objectives (CNRA 2022):
- Protect and restore biodiversity
- Expand equitable access to nature
- Mitigate and build resilience to climate change
Protected areas are a powerful tool for safeguarding biodiversity, but many of those established in past decades were designated opportunistically, reflecting historical conservation priorities and political circumstances more than systematic planning. As a result, California’s existing protected lands do not necessarily capture the full ecological diversity of the state. If conservation efforts fail to encompass the breadth of California’s ecosystems, the species and ecological processes that depend on unprotected habitats will remain vulnerable.
Ideally, the future network of conserved lands will represent the full diversity of each region—across species, communities, and ecological systems—and will be well connected. Representation of biodiversity within a connected network of protected areas is a foundational principle of conservation planning (Margules & Pressey 2000) and an essential first step toward ecological resilience (Halpin 1997). Systematic conservation planning seeks to ensure that protected areas are both effective at conserving biodiversity and efficient in the use of limited resources.
WHERE DO WE STAND IN 2025?
The year 2025 marks the halfway point in the decade for achieving California’s 30×30 objectives—a natural moment to assess progress and recalibrate strategies. As of June 2025, 26.1% of California lands meet the criteria for ‘durable conservation,’ meaning they are protected and managed in perpetuity for biodiversity. Our study here was conducted based on data available in September 2024, before CNRA published its most recent (June 2025) update. As of September 2024, 25.2% of California lands met the 30×30 criteria, representing an increase of 1.5 million acres (for example the 13,500 Las Piletas Ranch Preserve – Figure 1) since the launch of 30×30 effort; an additional 4 million acres are needed to reach the 30% target.
The next five years will be critical. Assessing how effectively current 30×30 Conservation Areas capture biodiversity can help guide where, how, and for what purposes new conservation efforts should be focused. As a leader in climate action and environmental policy, California can demonstrate a science-driven, equity-centered model for meeting 30×30.
In this assessment, we evaluate how well the state’s 30×30 Conservation Areas represent biodiversity, identify major gaps, and highlight opportunities to advance the terrestrial component of California’s 30×30 goal. We examined vegetation types, species richness and rarity, connectivity features, freshwater resources, climate-relevant features, and other biodiversity-critical elements both within the 30×30 Conservation Areas and across other public and private lands. Specifically, we:
- Describe the characteristics and composition of the 30×30 Conservation Areas network; and
- Assess representation of habitats and other ecological features within the network and outline conservation strategies to address identified gaps.
CONSERVATION NEED AND OPPORTUNITY FRAMEWORK
To evaluate the adequacy of protection for different features, we developed a conservation need and opportunity framework and applied it consistently to all biodiversity-relevant habitats and features.
We compared the statewide level of conservation for each feature to the percentage of California’s land in the 30×30 Conservation Areas as of September 2024 (25.2%).
- Features with ≥25.2% of their extent in 30×30 Conservation Areas are considered on par with statewide conservation levels. For these, conservation opportunities should focus on priorities such as:
- Improving representation within specific ecoregions or watersheds,
- Protecting rare or endemic species within those habitats,
- Enhancing connectivity, and
- Prioritizing lands important for disadvantaged communities or cultural values.
- Features with 20–25.2% of their extent in 30×30 Conservation Areas are considered slightly under-represented and would benefit from additional conservation to reach or surpass statewide coverage levels.
- Features with <20% of their extent in 30×30 Conservation Areas are considered under-represented and in higher need of conservation action.
In some cases, simply reaching statewide conservation levels is not sufficient. We identify rare or highly impacted habitats—those that comprise ≤3% of the state (e.g., coastal migration space), have been historically converted (e.g., wetlands), or support critical ecosystem functions (e.g., connectivity linkages)—as Key Features. For these, we recommend protecting all remaining examples wherever feasible.
We excluded non-typological, value-based features—such as Top Ranked Biodiversity and species richness—from the representation thresholds because these datasets represent only the top portion (e.g., the top quintile) of continuous data. In a network designed to protect the most biologically rich places, these high-value features should, by definition, be disproportionately represented.
In addition to assessing conservation need, we identified conservation pathways for each feature or habitat (Appendix Figures S1-S2 – Online). For some features, most remaining opportunities lie on other conserved or public lands (outside the 30×30 Conservation Areas), suggesting a focus on improving management or increasing durability. For others, remaining opportunities occur primarily on non-conserved lands, pointing to the need for new acquisitions or conservation easements.
METHODS
Land Categorization
To qualify as a “30×30 Conservation Area,” lands or coastal waters must be “durably protected and managed to sustain functional ecosystems—both intact and restored—and the diversity of life they support.” California uses GAP Analysis Project (GAP) status codes 1 and 2 to identify areas counted as conserved under the 30×30 initiative. Two key geospatial datasets—California Protected Areas Database (CPAD) and California Conservation Easement Database (CCED)—are used to define, track and provide information about lands protected across the state, including GAP status. To improve the accuracy of GAP status, GreenInfo Network and CNRA spearheaded a data improvement process by which agencies and organizations could review and submit their own GAP codes via a toolkit (https://calands.org/30×30-toolkit/).
For this analysis, we classified California lands into four categories:
- 30×30 Conservation Areas (GAP 1 and GAP 2 lands)
- Other conservation areas (GAP 3)
- Other public lands or lands with unknown status (GAP 4)
- Non-conserved lands (all remaining areas outside the 2024 Conservation Areas dataset)
We used the 2024 high-resolution 30×30 CA Conservation Areas Dataset (CNRA 2024) dissolved by GAP status to create multi-part zones for each GAP category. We overlaid these zones with a combined layer of 30×30 ecoregions (n = 20) and county boundaries (CAL FIRE 2019). Areas present in the ecoregion/county layer but absent from the CNRA conservation areas layer were classified as non-conserved lands.
This combined dataset of GAP status, ecoregions, and counties formed the analytical base layer. All habitat and feature data were summarized within these polygons defined by unique combinations of GAP category, ecoregion, and county.
Habitat and Feature Data
Under the umbrella of the California Biodiversity Network, we convened a working group of experts from government agencies, non-profit organizations, and academia to identify the best-available data for characterizing biodiversity in California. Whenever possible, we used datasets aligned with CNRA’s Mapping and Data Tools and incorporated newer research published after these mapping and data tools launched in 2022 (CNRA 2025).
Appendix Table S1 (Link) lists the feature data, metrics, and data sources used in the analysis. Features include major and specific habitats, species richness by taxa, endemism, and rarity, freshwater features, habitat connectivity, bird abundance, fungi, prokaryote, and invertebrate communities derived from eDNA, and climate zones. We summarized all features as either area (acres), length (miles), or counts, and we calculated:
- The percentage of the 30×30 Conservation Areas network composed of each feature (network composition), and
- The percentage of each feature’s statewide extent occurring within each land category (representation and gaps).
Most datasets represented discrete habitat types (e.g., wetlands, streams, oak woodland) or categorical conditions (e.g., channelized connectivity, resilient and well-connected landscapes). For continuous or ranked datasets such as ACE Top Ranked Biodiversity and ACE species richness, we converted them into discrete features by applying thresholds (e.g., top quintile or highest rank).
RESULTS
Land Characterization
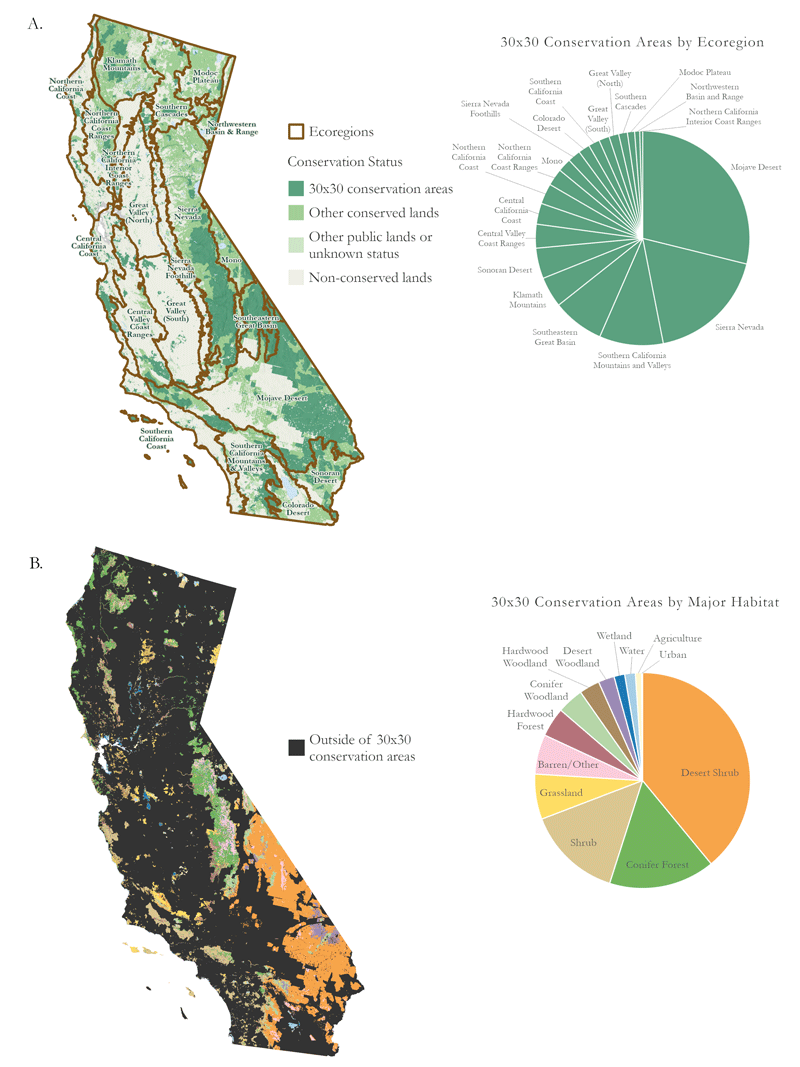
As of September 2024, 25.2% of California is within 30×30 Conservation Areas. An additional 23.9% is in other conserved lands (GAP 3), 2.2% in other public lands or lands with unknown status (GAP 4), and 48.7% remains in non-conserved lands (Figure 2A).
Network Composition
The Mojave Desert accounts for 28.8% of the network, followed by the Sierra Nevada (18%), Southern California Mountains and Valleys (9.6%), and the Southeastern Great Basin (7.7%)(Figure 2A).
Because the Mojave Desert comprises the largest share of the network, desert shrub habitats (e.g., desert scrub, desert wash) dominate, representing 39% of 30×30 Conservation Areas (Figure 2B). Conifer forests account for 16%, and other shrub habitats (chaparral, coastal scrub, bitterbrush, sagebrush) make up 14%. Together, these three broad habitat groups constitute more than two-thirds of the total area within California’s 30×30 Conservation network.
Climate and disturbance pressures are already reshaping the network. Roughly one-third of the network’s vegetation (33%) is projected to be stressed by mid-century climate change (Thorne 2016). About 0.7% of the network is at risk from sea-level rise, and 12% has burned in wildfires in the past decade. Though fire is both natural and beneficial to some systems, recent fire events have burned with higher severity, intensity, or frequency than historically beneficial fires (Miller 2009).
Representation and Gaps
We assessed how habitats and other ecological features are distributed across 30×30 Conservation Areas, other conserved lands, other public/unknown status lands, and non-conserved lands. This lens reveals where future conservation actions—both public and private—can most effectively advance 30×30 biodiversity outcomes to build a more representative, resilient, and connected network of biodiverse lands.
Habitat
Some habitats are well represented within 30×30 Conservation Areas, while others are substantially under-represented (Figure 2B, Table 1). Desert habitats, for example, are at or above statewide conservation levels. For these habitats, additional conservation of desert habitats can focus on rare species, or important areas for connectivity, climate resilience, or equitable access. In contrast, grasslands, blue oak woodland, valley oak woodland, and blue oak–foothill pine are all poorly represented, with most of their remaining extent on non-conserved lands. These habitats are strong candidates for new acquisitions or conservation easements.
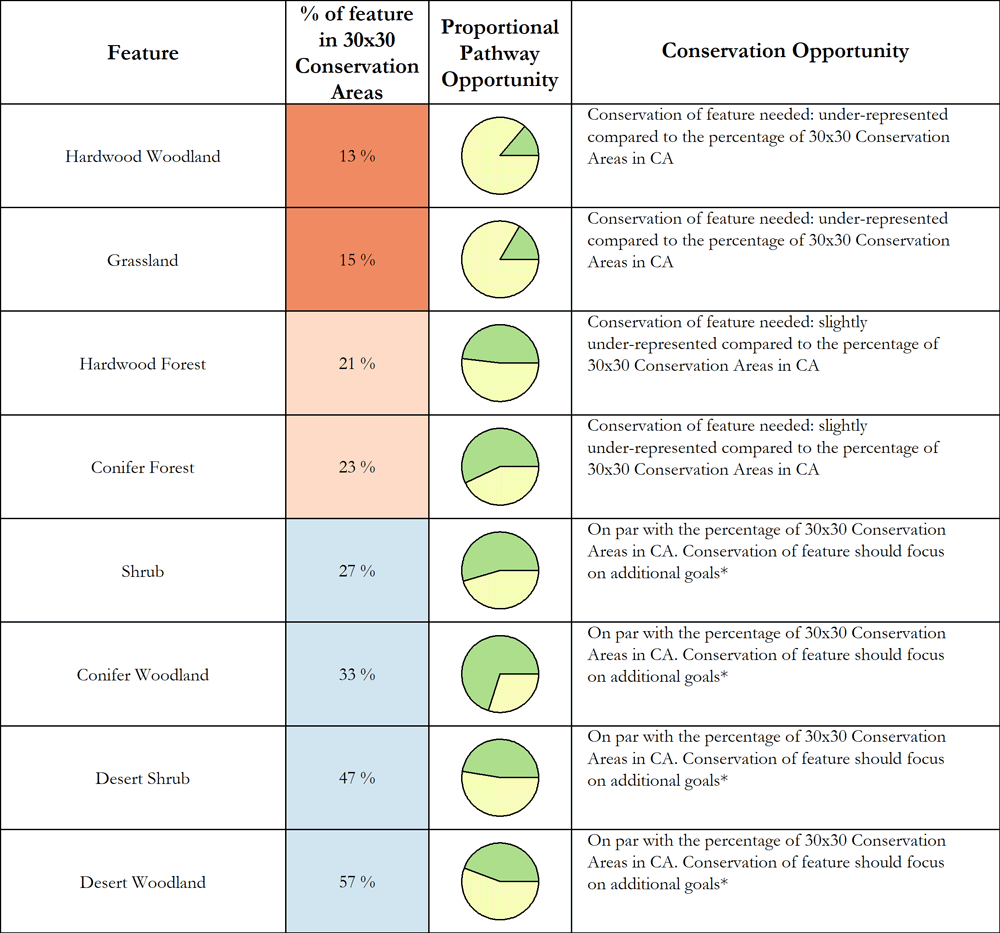
Other under-represented habitats, such as conifer and hardwood forests, are more widely distributed across GAP 3 and GAP 4 lands. There, conservation opportunities include improving management to prioritize biodiversity and increasing the durability of protection, for example by retiring extractive uses.
Half of the finer-resolution natural terrestrial habitat associations are under-represented relative to statewide conservation levels (Appendix Table S2 – Online). Eastside pine and ponderosa pine are among the most under-represented, with only 4% and 8% of their extent, respectively, conserved within 30×30 Conservation Areas. For eastside pine, the primary pathway is improving management and durability on existing conserved and public lands, whereas for ponderosa pine the opportunity is split between management changes on conserved lands and new conservation on non-conserved lands. Blue oak–foothill pine, blue oak woodland, and valley oak woodland all have less than 10% of their extent within 30×30 Conservation Areas, with most opportunity for additional conservation on non-conserved lands.
Species Richness
Because biodiversity rank and richness data (CDFW 2018, Kling et al. 2019) are derived from continuous surfaces, we evaluated top-ranked or top-quintile areas rather than comparing them directly to statewide conservation levels. In a conservation network that effectively captures biodiversity, the highest-ranked and most species-rich areas should be well represented. Our results indicate that this is not yet the case: the top-ranked areas for overall biodiversity and rare biodiversity—both statewide and within ecoregions—are represented at levels below statewide conservation percentages (Appendix Table S3 -Online).
Although plant richness, endemic plant rarity-weighted richness, and reptile richness are roughly comparable to statewide conservation levels, less than half of the most species-rich areas are in the 30×30 Conservation Areas. Representation is particularly low for birds, amphibians, and rare reptiles, whose remaining high-richness areas lie largely on non-conserved lands, again suggesting a need for acquisitions or easements (Appendix Table S4 – Online). In contrast, many of the remaining opportunities to conserve the richest areas for plants and mammals occur on public or other conserved lands, where improved management and more durable protection could substantially improve outcomes.
Connectivity
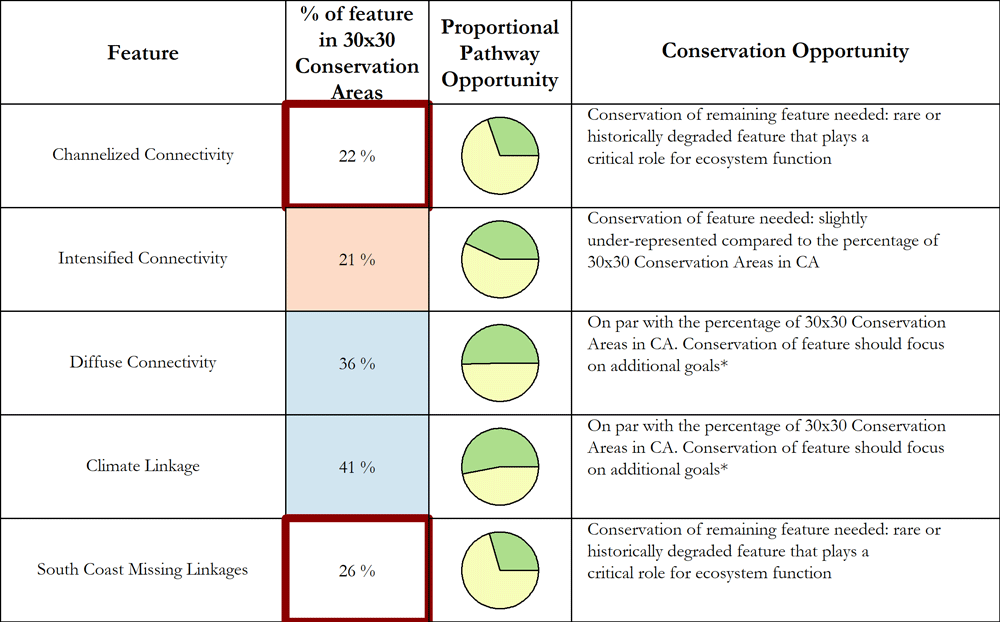
Channelized connectivity features (Cameron et al. 2022) and key linkages (e.g. those identified in the South Coast Missing Linkages project; South Coast Wildlands 2008) are conserved at levels below overall statewide conservation coverage (Table 2). These features are narrowly distributed yet critical for maintaining ecosystem function, making conservation of their remaining extent a high priority. Some linkages could be secured through improved management and enhanced durability of GAP 3 and 4 lands, but many occur on non-conserved lands that will require acquisitions or easements. Intensified connectivity is somewhat under-represented, whereas diffuse connectivity and climate linkages occur at levels comparable to overall 30×30 coverage.
Freshwater Resources
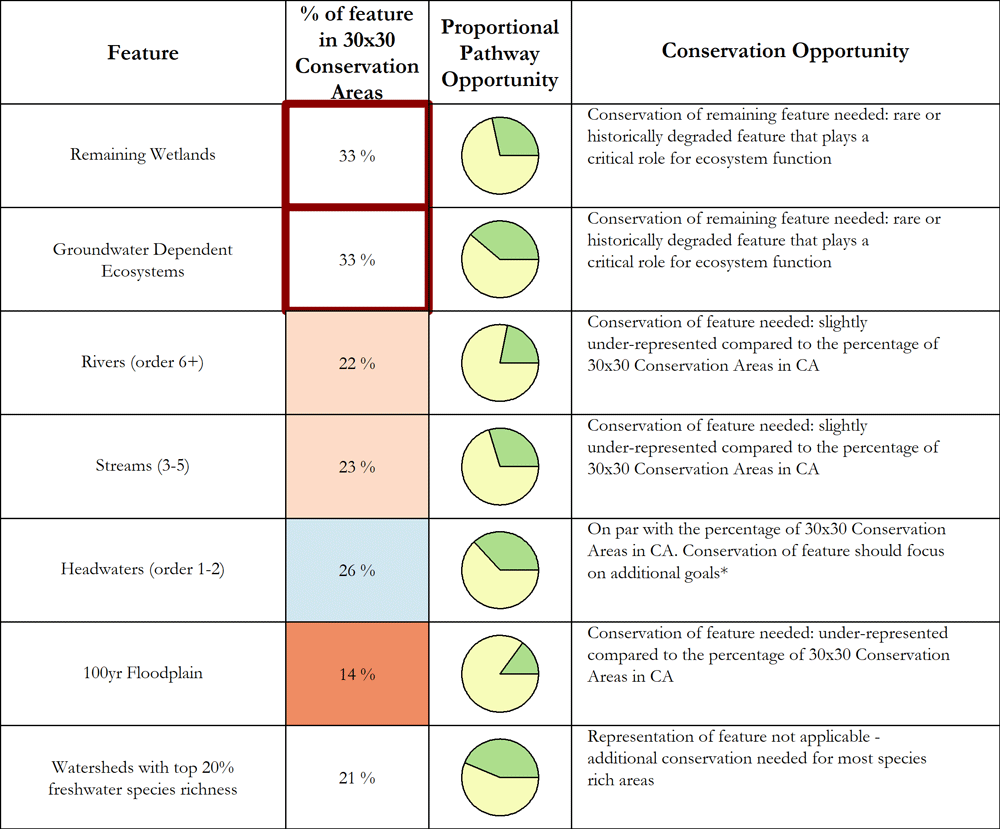
Freshwater habitats emerge as both relatively well represented and highly vulnerable. About 33% of remaining wetlands and groundwater-dependent ecosystems are in 30×30 Conservation Areas, but their historical loss, restricted distribution, and crucial role in ecosystem function underscore the need to conserve the remaining extent of these habitats (Table 3). Major rivers (22%) and mid-sized streams (23%) are slightly under-represented relative to overall conservation coverage, while headwater streams (26%) are on par with statewide levels. The 100-year floodplain (14%) is notably under-represented, a clear opportunity for future conservation. Only 21 of watersheds with the highest freshwater species richness (21%) are in 30×30 conservation areas pointing to the need for targeted protections.
Additional information on other biodiversity features, climate, and ecosystem services is available in supplementary materials, along with a web-based CA 30×30 Planning & Assessment Tool developed as a companion to this analysis (Buhler & Boettiger 2025).
DISCUSSION
This assessment highlights both progress and persistent challenges in meeting California’s 30×30 objectives. Ecoregional and habitat imbalances in the network as of September 2024 underscore the importance of targeted conservation. Habitats such as hardwood woodlands and grasslands are markedly under-represented and primarily occur on non-conserved lands, emphasizing the need for strategic acquisitions and easements. Conifer forests and woodlands are only slightly under-represented, with more balanced opportunities for both management-based conservation on existing conserved lands and new protection on non-conserved lands.
California has a long history of land protection. Only recently, however, have conservation decisions been guided by explicit biodiversity priorities and principles such as representation, connectivity, and resilience. Ensuring that the 30×30 Conservation Area network effectively addresses biodiversity decline will require increased focus on:
- The most species-rich and highest-ranked biodiversity hotspots,
- Rare and functionally critical habitats, and
- Under-represented ecosystems and ecoregions.
The findings here can help prioritize where additional conservation will most effectively advance 30×30. For habitats with low representation within the 30×30 Conservation Areas—such as grasslands, blue oak woodland, valley oak woodland, and blue oak–foothill pine—increasing conservation to meet or exceed statewide levels is a clear objective, primarily via acquisitions and easements on non-conserved lands. Where representation is already relatively high, as in many desert habitats, new investments in these habitats may best focus on fine-filter targets such as rare and endemic species, improving ecoregional representation, strengthening connectivity and climate resilience, protecting cultural significance, and advancing equitable access for disadvantaged communities.
Climate change adds urgency. Projections that one-third of the network’s vegetation will face climate stress, combined with recent wildfire activity, highlight the need for a conservation strategy that is explicitly climate-aware. Fire remains a natural and often beneficial process, but increasingly severe fires and shortened return intervals can drive ecosystem transitions. Building resilience into the 30×30 network will depend on:
- Ensuring representation of habitats within and across ecoregions and watersheds,
- Maintaining redundancy across climatic gradients,
- Prioritizing areas projected to remain climatically stable or that contain high microclimatic diversity, and
- Creating a connected network of conservation areas that allows for movement.
While the expansion of 30×30 Conservation Areas has added roughly 2.5 million acres, nearly 4 million more acres are needed to reach the 2030 goal. Accelerating progress on non-conserved lands will require aligning state conservation funding with durable management (GAP 1 or 2), coupled with clear expectations for data submission on boundaries and GAP status so that conservation investments translate into measurable gains. Under-represented ecosystems and key features—grasslands, oak woodlands, wetlands, floodplains, and connectivity corridors—should remain high priorities, many of which lie on non-conserved lands. Engaging landowners through incentive programs, voluntary easements, and collaborative conservation models will be critical in the years ahead.
CAVEATS
This analysis focuses on three of the ten pathways identified by the state to meet 30×30 goals: executing strategic land acquisitions, increasing voluntary conservation easements, and enhancing conservation of existing public lands and coastal waters. Other strategies—such as restoration, stewardship, and policy changes that do not directly contribute to the “30% by area” accounting—are not evaluated here, though they are essential for ensuring that California’s ecosystems are thriving and resilient.
Biodiversity data are inherently incomplete and evolving. Ongoing sampling and monitoring are needed to improve our understanding of species distributions and ecosystem condition. While this assessment represents the most comprehensive, up-to-date datasets currently available, gaps and uncertainties remain, particularly where data must be inferred statistically.
Additionally, in the CA Conservation Areas dataset, an entire polygon is included in the 30×30 Conservation Areas network if at least 80% of its area has GAP 1 or GAP 2 status. If less than 80% of a polygon meets this threshold, the entire polygon is excluded. Because GAP status in the underlying datasets (CPAD and CCED; GreenInfo Network 2021a, 2021b) is applied proportionally rather than spatially within polygons, this method can lead to both over- and under-estimates of habitat and feature representation.
CONCLUSION
At the halfway mark to 2030, California has made meaningful progress toward its 30×30 conservation goals, yet substantial work remains. The state’s diverse landscapes call for a balanced approach that strengthens existing protections, expands conservation in under-represented regions and habitats, and explicitly incorporates climate resilience and equity.
Looking ahead, success will depend on strategically securing new lands for durable protection, improving management on existing conserved and public lands, and addressing representation gaps for vulnerable habitats and key biodiversity features. If these next steps are implemented thoughtfully and at scale, California’s 30×30 initiative can help build an interconnected, well-managed conservation network capable of sustaining the state’s extraordinary biodiversity in a rapidly changing world.
ACKNOWLEDGEMENTS
Thank you to the current CBN Steering Committee for guidance and review, including: Steven Monfort, Jeanette Howard, Jun Bando, Ben Becker, Gary Bucciarelli, Liz Chamberlin, Megan Jennings, Rebecca Johnson, Rachael L. Olliff-Yang, Dena Spatz, Kim Tenggardjaja, and Sam Veloz. We are grateful for the advice and guidance from the California Natural Resources Agency, including Madeline Drake, Meghan Hertel, and Cole Dickinson. CBN support for working group convenings and writing was funded in part by Moore Foundation funding to CBN (Grant #11615) and from the Resources Legacy Fund to R.L.O.-Y. Data analysis, writing and design support funded by The Nature Conservancy.
—This assessment was prepared by Jeanette Howard (The Nature Conservancy/ California Biodiversity Network), Carrie Schloss (The Nature Conservancy), Rachael Olliff Yang (California Biodiversity Network); Alicia Canales, Charlotte K. Stanley, and Megan Webb (The Nature Conservancy), David Ackerly, Carl Boettiger, Cassie Buhler, and Steven Monfort (University of California, Berkeley, and the UC Natural Reserve System), Gary Bucciarelli (University of California, Davis), Rachel Meyer and Ariel Levi Simons (University of California, Santa Cruz), Jun Bando (California Native Plant Society), Liz Chamberlin and Sam Veloz (Point Blue Conservation Science), Cole Dickison (California Natural Resources Agency), Avery Hill and Rebecca Johnson (California Academy of Sciences), Ryan Hill (California Department of Fish and Wildlife), Amanda Kochanek and Dan Rademacher (GreenInfo Network,; Lisa Micheli (Wildlands Network), Kristeen Penrod (South Coast Wildlands), Giovanni Rapacciuolo (Elimia); Nathaniel Roth (California Department of Conservation), Dena Spatz (California State Parks), Megan Webb (The Nature Conservancy), and Daniel Gluesenkamp (California Institute for Biodiversity).
REFERENCES
- Buhler, C. K., and C. Boettiger. 2025. CA 30×30 Planning & Assessment Tool (v1.0.5). Zenodo. https://doi.org/10.5281/zenodo.16988638
- California Department of Fish and Wildlife (CDFW). 2025. California’s State Wildlife Action Plan (SWAP). https://wildlife.ca.gov/SWAP
- California Department of Forestry and Fire Protection (CAL FIRE). 2019. California county boundaries.
- California Natural Resources Agency (CNRA). 2022. Pathways to 30×30: Accelerating conservation of California’s nature. https://canature.maps.arcgis.com
- California Natural Resources Agency (CNRA). 2024. 30×30 conserved areas, terrestrial (240628 hR SGB minfields). https://www.californianature.ca.gov
- California Natural Resources Agency (CNRA). 2025. 30×30 conserved areas, terrestrial (2025). https://www.californianature.ca.gov
- California Natural Resources Agency (CNRA). 2025. CA Nature: A suite of interactive mapping and visualization tools. https://www.californianature.ca.gov/pages/ca-nature
- Cameron, D. R., C. A. Schloss, D. M. Theobald, and S. A. Morrison. 2022. A framework to select strategies for conserving and restoring habitat connectivity in complex landscapes. Conservation Science and Practice 4(6): e12698.
- Crossley, M. S., et al. 2020. No net insect abundance and diversity declines across US Long Term Ecological Research sites. Nature Ecology & Evolution 4(10): 1368–1376.
- GreenInfo Network. 2021a. California Conservation Easement Database (CCED). https://www.calands.org
- GreenInfo Network. 2021b. California Protected Areas Database (CPAD). https://www.calands.org
- Halpin, P. N. 1997. Global climate change and natural-area protection: management responses and research directions. Ecological Applications 7: 828–843.
- Hamilton, H., et al. 2022. Increasing taxonomic diversity and spatial resolution clarifies opportunities for protecting US imperiled species. Ecological Applications 32(3): e2534.
- Kling, M. M., et al. 2019. Facets of phylodiversity: evolutionary diversification, divergence and survival as conservation targets. Philosophical Transactions of the Royal Society B 374(1763): 20170397.
- Liebert, A. S., and W. J. Ripple. 2004. Range contractions of North American carnivores and ungulates. BioScience 54: 123–138.
- Margules, C. R., and R. L. Pressey. 2000. Systematic conservation planning. Nature 405: 243–253.
- Miller, J. D., H. D. Safford, M. Crimmins, et al. 2009. Quantitative evidence for increasing forest fire severity in the Sierra Nevada and Southern Cascade Mountains, California and Nevada, USA. Ecosystems 12: 16–32.
- Myers, N., et al. 2000. Biodiversity hotspots for conservation priorities. Nature 403(6772): 853–858.
- Rosenberg, K. V., et al. 2019. Decline of the North American avifauna. Science 366(6461): 120–124.
- South Coast Wildlands. 2008. South Coast Missing Linkages: A wildland network for the South Coast Ecoregion. http://www.scwildlands.org
- Thorne, J. H., et al. 2016. A climate change vulnerability assessment of California’s terrestrial vegetation. California Department of Fish and Wildlife, Sacramento, California.